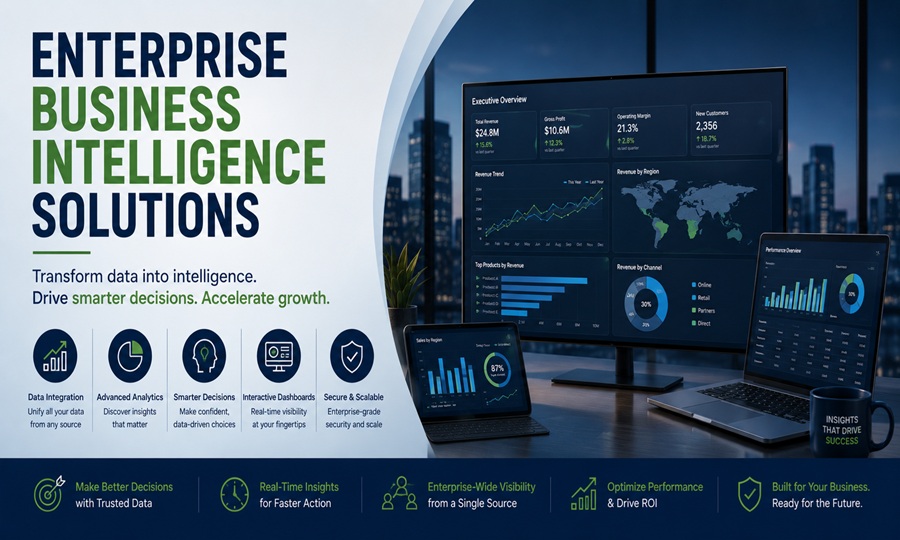
Most enterprise technology purchases that fail don’t fail because the software was bad. They fail because the organization bought a capability it wasn’t ready to use, deployed it in ways disconnected from actual decision-making, or treated the implementation as an IT project rather than a business transformation. Business intelligence is the category where this pattern repeats more consistently than almost any other.
Understanding what enterprise BI solutions actually do, what separates the platforms worth considering from those worth avoiding, and how to structure a selection and implementation process that produces usable outcomes rather than expensive shelf-ware is worth doing carefully before any purchase decision is made.
What Enterprise Business Intelligence Actually Means
Business intelligence is the technology, processes, and practices for collecting, integrating, analyzing, and presenting business data to support better decision-making. Enterprise BI solutions are platforms designed to do this at organizational scale, across multiple data sources, for large numbers of users with varying technical capabilities and different analytical needs.
The core capability of a BI platform is transforming raw data from disparate sources into visualizations, reports, and analytical models that make patterns, trends, and anomalies visible to the people who need to act on them. A sales director needs to see pipeline by territory and rep performance against quota. A supply chain manager needs inventory levels by location against reorder thresholds. A CFO needs consolidated financial performance against budget with variance explanation. An operations manager needs throughput by production line against target. These are different analytical views that BI platforms generate from the same underlying data infrastructure.
Modern enterprise BI platforms do more than produce static reports. They support self-service analytics where non-technical users explore data independently, embedded analytics where BI capabilities are built into operational applications, and increasingly, AI-assisted analysis that surfaces insights users didn’t know to look for.
The Major Platforms: What Each One Actually Does Well
The enterprise BI market is dominated by a small number of platforms that account for the majority of enterprise deployments. Understanding what each does distinctively well helps match platform selection to organizational requirements rather than vendor marketing.
Microsoft Power BI
Power BI has become the most widely deployed enterprise BI platform globally, driven primarily by its deep integration with the Microsoft ecosystem. Organizations already running Microsoft 365, Azure, and Dynamics have a natural path to Power BI that reduces integration friction considerably. Power BI Premium is included in Microsoft Fabric, the company’s unified analytics platform, which has shifted the pricing model for large enterprise deployments.
Power BI’s strength is its combination of accessibility for business users through Power BI Desktop and its enterprise governance capabilities for IT organizations managing large-scale deployments. The DAX query language that powers its analytical calculations has a steep learning curve that creates a skills dependency on trained developers for complex analytical models, but the surface-level reporting experience for end users is among the most accessible in the category.
For organizations standardized on Microsoft infrastructure, Power BI is the default choice that requires specific reasons to override rather than a candidate among equals.
Tableau
Tableau built its reputation on visualization quality and the depth of its analytical exploration capabilities. Acquired by Salesforce in 2019, it has continued to develop as a premium analytics platform positioned toward organizations that prioritize analytical depth over Microsoft ecosystem integration.
Tableau’s visual analytics model allows users to explore data through direct manipulation of visualizations in ways that report-centric platforms don’t support as naturally. For organizations with analytically sophisticated users who need to explore data rather than consume pre-built reports, Tableau’s exploration model is a genuine differentiator.
The Salesforce acquisition has accelerated integration between Tableau and Salesforce CRM data, making it a natural choice for Salesforce-centric organizations. The ongoing development of Tableau Pulse, which uses AI to surface data insights proactively, reflects the broader industry direction toward AI-augmented analytics.
Qlik Sense
Qlik’s associative data model, which allows users to explore relationships across all data simultaneously rather than navigating predefined hierarchical structures, produces a genuinely different analytical experience than dashboarding tools. It makes cross-data discovery more natural but requires more investment in data modeling and implementation to deploy effectively.
Qlik is positioned toward organizations that need advanced analytics capabilities and have the technical resources to implement them. It’s less commonly the default recommendation for organizations starting their BI journey than Power BI or Tableau, but organizations with complex analytical requirements and strong technical implementation teams find it highly capable.
Looker
Google’s acquisition of Looker and its integration into Google Cloud’s data analytics stack has positioned it as the BI layer for organizations building on BigQuery and the broader Google Cloud ecosystem. Looker’s LookML modeling language creates a semantic layer between raw data and end-user analytics that enforces consistent business logic across all analyses.
The semantic layer approach is particularly valuable in large organizations where different teams calculating the same metric from raw data independently produces inconsistent results. Defining revenue, active users, or conversion rate once in LookML and having all analyses use that definition eliminates the “which number is right” problem that plagues BI environments without centralized semantic layers.
ThoughtSpot
ThoughtSpot has built its product around natural language search and AI-generated insights, allowing users to ask questions of their data in plain English and receive analytical responses without constructing queries or building dashboards. For organizations where the primary bottleneck is non-technical users’ ability to access data independently, ThoughtSpot’s approach removes a significant barrier that traditional BI tools don’t address as directly.
The Data Infrastructure That BI Requires
Enterprise BI platforms don’t create analytical capability on their own. They visualize and analyze data that has been collected, stored, integrated, and prepared in the underlying data infrastructure. The quality of that infrastructure determines the quality of the BI output more than the platform selection does.
Modern enterprise data infrastructure typically follows a cloud data warehouse architecture where data from operational systems including ERP, CRM, marketing platforms, and transactional databases is loaded into a central analytical repository. Cloud data warehouses including Snowflake, Google BigQuery, Amazon Redshift, and Microsoft Synapse Analytics provide the storage and compute foundation that BI platforms query.
The data pipeline that moves data from source systems to the data warehouse requires ETL or ELT tooling, data quality management, and governance processes that ensure the data being analyzed is accurate, complete, and current. Organizations that attempt to deploy enterprise BI on top of poorly governed, incomplete, or inaccurate data produce analytics that users learn not to trust, which is worse than no analytics because it creates confident errors rather than acknowledged uncertainty.
The data modeling layer between raw warehouse data and BI platform queries has become increasingly important as the complexity of enterprise data environments has grown. Tools including dbt have become standard components of modern data stacks precisely because they provide version-controlled, tested transformation logic that ensures consistency between what the data warehouse contains and what the BI platform reports.
Implementation: Where Enterprise BI Projects Succeed and Fail
The implementation patterns that produce successful enterprise BI deployments are consistent enough to be prescriptive.
Starting with high-value, high-visibility use cases rather than attempting to build comprehensive analytical coverage of all business functions simultaneously produces faster time to value and builds organizational credibility for the program. The first BI deployment that produces something a senior leader uses to make a real decision is worth more to long-term program success than a comprehensive data model that nobody has accessed after six months.
Executive sponsorship that goes beyond approval to active use is the organizational condition most correlated with successful BI programs. When senior leaders use BI outputs in their regular decision-making and hold their organizations accountable for data-informed decisions, usage cascades through the organization. When BI is positioned as a tool for analysts and managers who produce reports for executives who then make decisions based on different information, the program doesn’t achieve meaningful adoption.
Data governance established before or alongside BI deployment rather than as an afterthought prevents the downstream problems that undermine trust in analytics. Defining who owns which data, establishing data quality standards, and creating processes for resolving inconsistencies across sources is organizational work that no BI platform handles automatically.
User adoption programs that include training, champions within business units, and feedback mechanisms for improving the analytical content produce sustained usage. BI deployments that rely entirely on availability to drive adoption consistently underperform those with deliberate enablement programs.
Total Cost of Ownership Beyond License Fees
Enterprise BI platform pricing is complex enough that the license fee rarely represents the majority of total cost for large deployments. Understanding the full cost picture prevents the budget surprises that derail implementations.
Platform licensing follows several models across the major vendors. Power BI Premium per capacity charges are based on dedicated cloud compute rather than per-user seats, which changes the economics considerably for large user bases. Tableau charges per user with different tiers for Creator, Explorer, and Viewer roles. Qlik and Looker have moved toward consumption-based pricing for some deployment patterns alongside traditional user-based licensing.
Implementation services for enterprise BI deployments typically run between one and three times the first-year license cost. The implementation involves not just platform configuration but data integration, data modeling, dashboard development, security configuration, and user training. Organizations that underestimate implementation costs relative to license fees consistently run into budget and timeline problems.
Ongoing maintenance includes data pipeline management, data quality monitoring, dashboard updates as business requirements change, user support, and platform upgrades. The internal staff or managed service costs for ongoing BI operations are a recurring cost that initial business cases often underweight relative to the upfront implementation.
Infrastructure costs for cloud data warehouse compute and storage, separate from BI platform licensing, scale with data volume and query complexity. Workload optimization to manage cloud infrastructure costs is a discipline that large BI deployments require ongoing attention to.
Evaluating Vendors: What the Process Should Include
A rigorous enterprise BI vendor evaluation produces a selection decision that accounts for organizational requirements rather than vendor positioning.
Requirements definition should precede vendor engagement. Documenting the analytical use cases the platform needs to support, the technical environment it needs to integrate with, the user population and their technical capabilities, the governance and security requirements, and the organizational constraints on implementation approach gives vendors specific context to respond to rather than presenting their standard capabilities.
Proof of concept evaluation using the organization’s own data and representative use cases reveals how each platform actually performs against real requirements rather than how it performs on vendor-curated demonstrations. A platform that looks compelling in a sales demonstration and performs poorly when applied to the organization’s actual data complexity is a risk that POC evaluation surfaces before contract signing.
Reference customers in similar industries and organizational contexts provide the most reliable signal of implementation experience and ongoing platform performance. Vendor-provided references are necessarily curated, but direct outreach to users identified through professional networks or user communities produces more candid assessments.
Total cost of ownership modeling across a three to five year period, including license, implementation, infrastructure, and ongoing operations, should be completed for each shortlisted platform before final selection. The platform with the lowest license fee is frequently not the platform with the lowest total cost.
The Gartner Magic Quadrant for Analytics and Business Intelligence Platforms provides the most widely referenced independent assessment of enterprise BI vendor capabilities and market position, with detailed analysis of each platform’s strengths and limitations that supplements but should not replace an organization’s own evaluation process.
The Organizational Readiness Question
The most important question before committing to an enterprise BI platform isn’t which platform to choose. It’s whether the organization is ready to use one effectively.
Organizations with fragmented data in inconsistent formats across systems that don’t integrate, without data governance practices that establish which data is authoritative, and without executive commitment to data-informed decision-making will not realize meaningful value from enterprise BI regardless of which platform they deploy.
The investment required to address those foundational conditions is genuine, and it often exceeds the investment in the BI platform itself. But it’s the investment that determines whether the platform delivers value rather than adding to the collection of enterprise software that was purchased with high expectations and used with low frequency.
The sequence that produces successful outcomes is organizational readiness and data foundation first, platform selection second, and implementation third. Organizations that reverse that sequence, selecting a platform and expecting it to drive organizational and data readiness, consistently produce expensive implementations that don’t deliver the analytical capability they were purchased to provide.